5 Bottom Temperature (AZMP)
Data Type: Tabular Data
Spatial Scope: Scotian Shelf (4X, 4V, 4W)
Duration: 1950-2024
Source: DFO Atlantic Zone Monitoring Program via azmpdata
5.1 Introduction to Indicator
AZMP Bottom Temperature data represent derived and regionally summarized data from the Atlantic Zone Monitoring Program (AZMP), accessed via the azmpdata R package. In the DFO Maritimes region, an ecosystem survey across the Scotian Shelf, spanning the Cabot Strait to the Bay of Fundy, is conducted annually during months July and August. During the survey, oceanographic measurements are taken at randomly selected locations.
Temperature data from continuous downcast CTD profiles are interpolated to a defined grid using an objective analysis procedure, and results are spatially weighted for NAFO divisions 4Vn, 4Vs, 4W, and 4X (Layton et al. 2025).
5.2 View Data
library(plotly)

plotly_df <- data@data %>%
  left_join(global_cols2) # join in colors and region_group df

p <- plot_ly()

regions_order <- c("4Vn","4Vs","4W","4X")

for(r in regions_order){

  df_sub <- plotly_df %>% filter(region == r)

  group_name <- unique(df_sub$region_group)

  p <- p %>%
    add_lines(
      data = df_sub,
      x = ~year,
      y = ~mean_value,
      name = r,
      legendgroup = group_name,
      legendgrouptitle = list(
        text = ifelse(group_name == "ESS",
                     "Eastern Scotian Shelf Zones",
                     "Western Scotian Shelf Zones"
        )
      ),
      line = list(color = unique(df_sub$color), width = 2),
      text = ~paste0("<b>",region,"</b>: ",round(mean_value,2),"°C"),
      hoverinfo = "x+text"
    )
}

p %>%
  layout(
    title = "AZMP Bottom Temperature by Region",
    xaxis = list(title = "Year"),
    yaxis = list(title = "Sea Bottom Temperature (°C)", fixedrange = TRUE),
    hovermode = "x unified",
    legend = list(
      tracegroupgap = 5,
      groupclick = "toggleitem",
      itemdoubleclick = FALSE
    )
  ) %>%
  config(displayModeBar = FALSE)
Figure 5.1: AZMP Regional Bottom Temperature in Scotian Shelf Regions; 1950-2024
5.3 Summary and Trends
Trend and summary values are automatically generated; data were last updated on marea package install on 2026-02-10
Mean AZMP Bottom Temperature varies between regions, with NAFO Division 4X having the warmest mean temperature (7.64°C), and NAFO Division 4Vs having the lowest mean temperature (3.2°C). 3 regions had their series records within the last 10 years of sampling (2014-2024) (Fig. 5.1).
In the most recent year of sampling (2024), 1 region had values that are high compared to their overall timeseries (>70th percentile), 2 regions had values that were moderate (between 30th and 70th percentile), and 1 region had low values (<30th percentile) within their timeseries.
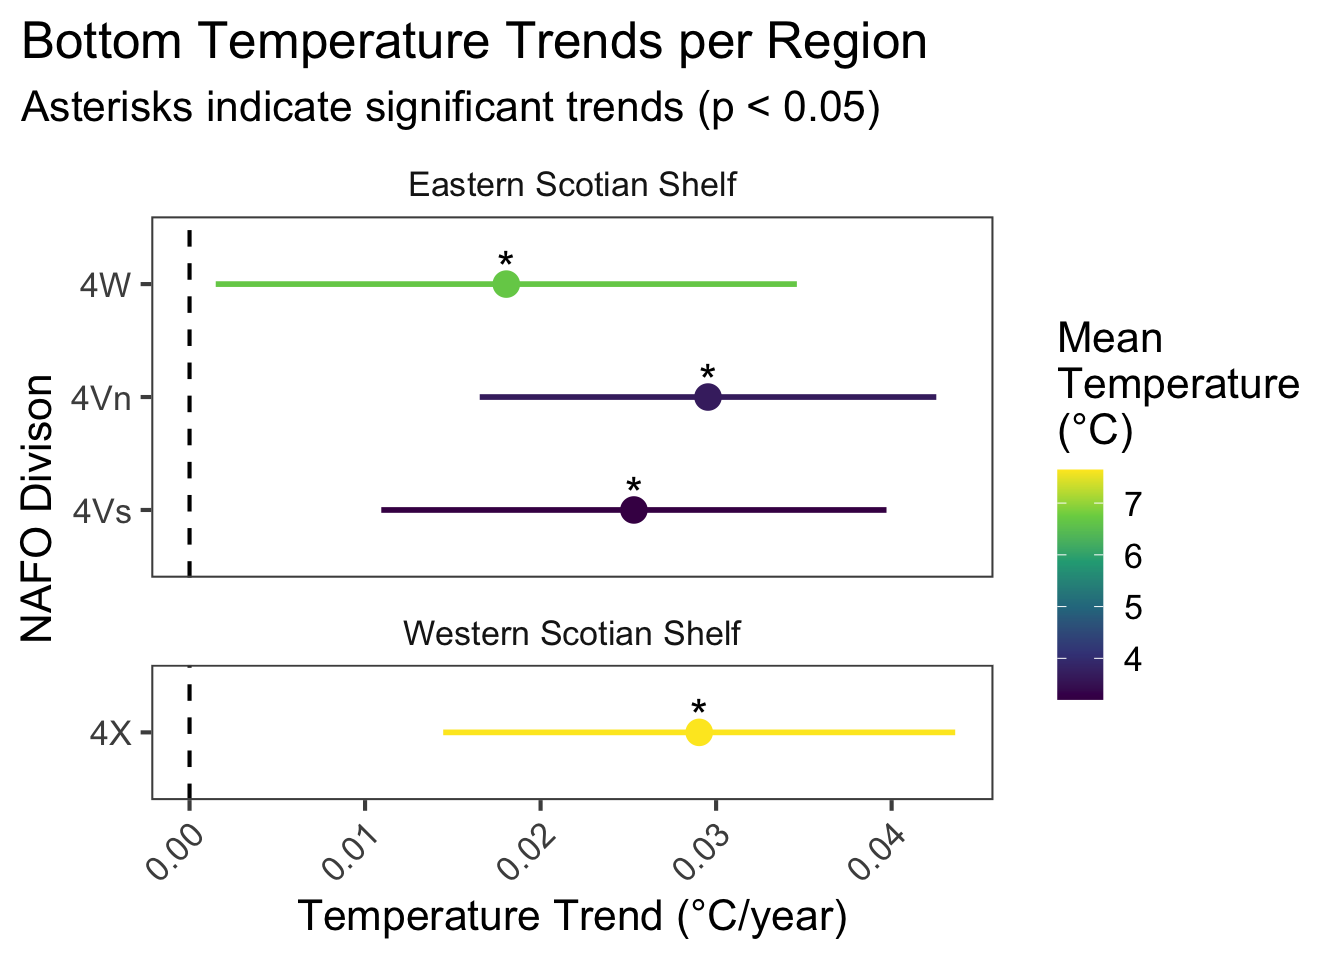
Figure 5.2: Model coefficients of bottom temperature over time for NAFO divisions in the Eastern and Western Scotian Shelf Regions; 1950-2024. Error bars represent 95% confidence intervals of model fits. Asterisks indicate significant trends (p value of year coefficient < 0.05).
The overall trend is increasing across regions. 4 regional subdivisions had increasing Bottom Temperature trends (all of which are statistically significant) and 0 had negative trends (Fig 5.2).
Average bottom temperature exhibited a general northward decrease between NAFO divisions (Fig 5.3), but warming trends were fairly consistent across zones (Fig. 5.2,5.3).
Figure 5.3: Map of target study areas colored by mean temperature (left) and warming trend over time (right).
5.3.1 Summary Table by Region
Summary values for the AZMP Bottom Temperature within each individual NAFO division in the Eastern and Western Scotian Shelf are shown below (Table 5.1)
| Metric | Eastern Scotian Shelf | Western Scotian Shelf |
|---|---|---|
| Mean Value (±SE) |
4Vn: 3.68±0.12°C 4Vs: 3.2±0.12°C 4W: 6.68±0.13°C |
4X: 7.64±0.13°C |
| Warming Trend (1950-2024) |
4Vn: 0.03°C/year * 4Vs: 0.025°C/year * 4W: 0.018°C/year * |
4X: 0.029°C/year * |
| Timeseries Record High |
4Vn: 2020 (5.27°C) 4Vs: 2015 (5.02°C) 4W: 2022 (9.26°C) |
4X: 2012 (9.53°C) |
| Timeseries Record Low |
4Vn: 1989 (2°C) 4Vs: 1990 (1.39°C) 4W: 2004 (4.73°C) |
4X: 1998 (5.45°C) |
5.4 Relevance to Research and Stock Assessments
Sea bottom temperature is highly relevant to population dynamics and spatial distributions, particularly for benthic or bottom-associated species. The effects of sea bottom temperature on fisheries is expected to be variable between regions and species, since thermal envelopes vary across species and shifts in temperature can increase or decrease preferred thermal habitat across regions.
In the Scotian Shelf-Bay of Fundy region, warming bottom temperatures have been associated with negative impacts and/or northward distribution shifts to key decapod species, northern shrimp and snow crab, for which this region represents the southernmost extent of both fisheries (Zisserson and Cook 2017; Chang et al. 2025). Alternatively, recent increases in bottom temperature across the Northwestern Atlantic have increased suitable thermal habitat for halibut in most Eastern Canadian NAFO divisons, and models project further increases in abundance within the Canadian range as bottom temperatures continue to increase (Shackell et al. 2022; Czich et al. 2023).
5.5 Variable Definitions
| variable | description | unit |
|---|---|---|
| year | Year of data collection | |
| region | Region over which records are summarized | |
| mean_value | Regionally-aggregated annual mean temperature | °C |