1 Surface Temperature from Satellite Data (AZMP)
Data Type: Tabular Data
Spatial Scope: Scotian Shelf (4X, 4V, 4W)
Duration 1982-2024
Source: DFO Atlantic Zone Monitoring Program via azmpdata
1.1 Introduction to Indicator
Sea surface temperature from satellite data refers to continuous sea surface temperature (SST) fields derived from satellite sensors, representing the temperature of the ocean’s surface. Here, continuous fields are summarized within non-mutually exclusive regions representing NAFO divisions or subzone divisions.
Sea surface temperature is influenced by a variety of conditions spanning multiple spatial and temporal scales. In this region, long-term trends in SST are consistent with expectations of anthropogenic climate change (Greenan et al. 2019). At the same time, decadal-to-interannual regional SST trends are influenced by atmospheric indicators like those described in this book, and short-term local values can be influenced by many oceanographic and climate factors, such as freshwater input, ocean currents, and weather events.
1.2 View Data
library(plotly)
plotly_df <- data@data %>%
  inner_join(global_cols2 )

p <- plot_ly()

regions_order <- c("4Vn","4Vs","4W","4XSS")

for(r in regions_order){

  df_sub <- plotly_df %>% filter(region == r)

  group_name <- unique(df_sub$region_group)

  p <- p %>%
    add_lines(
      data = df_sub,
      x = ~year,
      y = ~mean_value,
      name = r,
      legendgroup = group_name,
      legendgrouptitle = list(text =
        ifelse(r == "4Vn" & group_name == "ESS",
               "Eastern Scotian Shelf Zones",
        ifelse(r == "4XSS",
               "Western Scotian Shelf Zones",
               NA))
      ),
      line = list(color = unique(df_sub$color), width = 2),
      text = ~paste0("<b>",region,"</b>: ",round(mean_value,2),"°C"),
      hoverinfo = "x+text"
    )
}

p %>%
  layout(
    title = "AZMP SST by Division",
    xaxis = list(title = "Year"),
    yaxis = list(title = "Temperature (°C)", fixedrange = TRUE),
    hovermode = "x unified",
    legend = list(
      tracegroupgap = 5,
      groupclick = "toggleitem",
      itemdoubleclick = FALSE
    )
  ) %>%
  config(displayModeBar = FALSE)
Figure 1.1: AZMP Satellite Surface Temperature in Scotian Shelf Regions; 1982-2024
1.3 Summary and Trends
Trend and summary values are automatically generated; data were last updated on marea package install on 2026-02-10
Surface temperatures are less variable across the region compared to bottom temperature. Among regions in this dataset, mean surface temperatures range from 8.94°C in 4W to 6.83°C in 4Vn. 1 region had its series record within the last 10 years of sampling (2014-2024), and 0 regions had their series minima (Fig. 1.1).
In the most recent year of sampling (2024), 4 regions had values that are high compared to their overall timeseries (>70th percentile), 0 regions had values that were moderate (between 30th and 70th percentile), and 0 regions had low values (<30th percentile) within their timeseries.
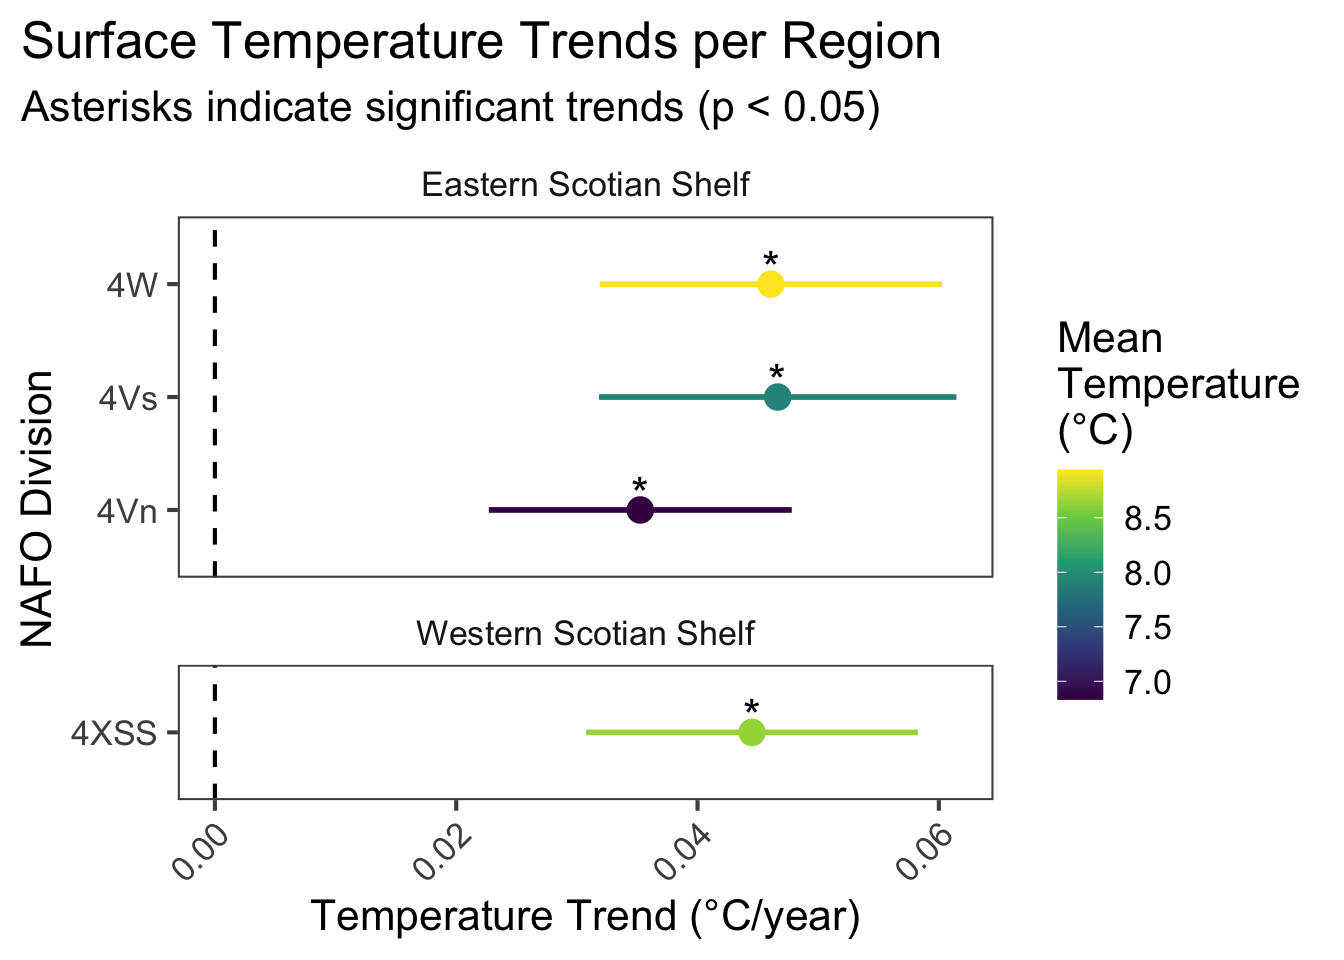
Figure 1.2: Coefficients of satellite surface temperature trends over time for NAFO divisions within Eastern and Western Scotian Shelf regions. Error bars represent 95% confidence intervals of model fits. Asterisks indicate significant trends (p < 0.05 for year term)
The overall trend is increasing temperature across regions. 4 regional subdivisions have increasing satellite surface temperature trends (4 statistically significant) and 0 have negative trends (Fig 1.2).
As with Bottom Temperature, average satellite surface temperature exhibited a general northward decrease between NAFO divisions (Fig 1.3), but warming trends were fairly consistent across zones (Fig. 1.2,1.3).
Figure 1.3: Map of target study areas colored by mean satellite surface temperature (left) and warming trend over time (right).
1.3.1 Summary Table by Region
Summary values for the AZMP Satellite Temperature within each individual NAFO division in the Eastern and Western Scotian Shelf are shown below (Table 1.1)
| Metric | Eastern Scotian Shelf | Western Scotian Shelf |
|---|---|---|
| Timeseries Mean (±SE) |
4Vn: 6.83±0.1°C 4Vs: 7.91±0.13°C 4W: 8.94±0.12°C |
4XSS: 8.63±0.12°C |
| Warming Trend (1982-2024) |
4Vn: 0.035 ± 0.01°C/year ∗ 4Vs: 0.047 ± 0.01°C/year ∗ 4W: 0.046 ± 0.01°C/year ∗ |
4XSS: 0.045 ± 0.01°C/year ∗ |
| Timeseries Record High |
4Vn: 2024 (8.29°C) 4Vs: 2012 (9.5°C) 4W: 2012 (10.55°C) |
4XSS: 2012 (10.43°C) |
| Timeseries Record Low |
4Vn: 1985 (5.6°C) 4Vs: 1985 (6.05°C) 4W: 1986 (7.46°C) |
4XSS: 1988 (7.13°C) |
1.4 Relevance to Research and Stock Assessments
Changes to sea surface temperature could have great impact on fisheries and stocks from both direct and indirect effects.
Sea surface temperatures can directly impact fisheries via changes to the distribution and phenology of key fisheries species (Hutchings et al. 2012). These changes are likely to result in the loss or decline of some commercially important species, but also the gain or increase of others. Atlantic Canada is projected to experience decreases in species and maximum catch in the Scotian Shelf and surrounding bioregions, but projected gains towards the Arctic (Cheung et al. 2010). These changes are consistent with expected poleward shifts if species track climatic envelopes towards the poles. Changes to surface temperature might also affect phenological processes of key species, including spawning times and predator/prey encounters.
Sea surface temperatures can also affect the physical and chemical properties of marine ecosystems, in turn, affecting species. Warming and freshening of surface waters can lead to increased stratification in coastal oceans, influencing primary productivity and nutrient cycling.
1.5 Variable Definitions
| variable | description | unit |
|---|---|---|
| year | Year of data collection | |
| region | NAFO region or subregion | |
| mean_value | Regionally summarized sea surface temperature, derived from satellite data | °C |